|
|
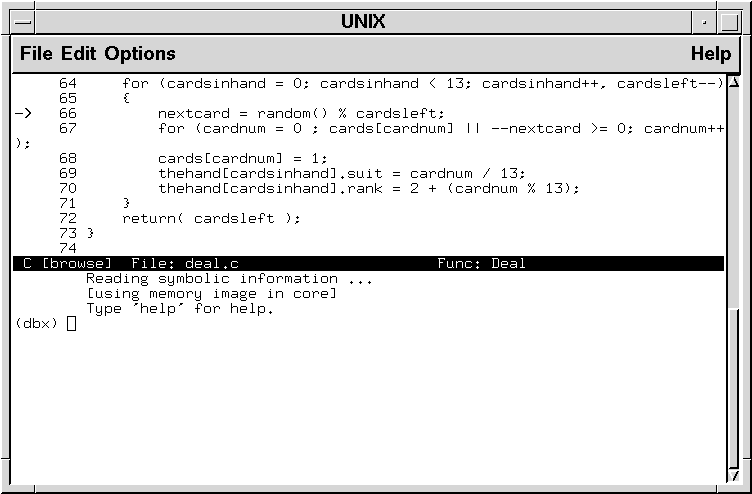
The figure below resembles a window with two panes separated by a narrow horizontal bar. The top pane contains lines of C code from the source file deal.c, and an arrow is pointing at line 66 where the illegal instruction that caused the core dump is located. The horizontal bar identifies the file (deal.c) and the function name (Deal). This bar constantly displays the name of the active function and the source file in which it appears.
The bottom pane, which contains the (dbxtra) prompt,
is where you interact with dbxtra.

Display contents after executing dbxtra a.out